Tag Archives: Mathematics

Why are we so proud of being ‘bad at maths’?

This post is adapted from my Indy Voices article of the same title originally published on 17/04/23

In front of an audience of students, teachers, education experts and business leaders, Rishi Sunak set out his plans to “transform our national approach to maths”.

Citing England’s “anti-maths mindset” the prime minister suggested: “We’ve got to start prizing numeracy for what it is – a key skill every bit as essential as reading.”

In an attempt to “not sit back and allow this cultural sense that it’s OK to be bad at maths” and to not “put our children at a disadvantage”, Sunak has commissioned an expert panel made up of mathematicians, education leaders and business representatives to figure out how to “fundamentally change our education system so it gives our young people the knowledge and skills they need”.

Plans to investigate how we can tackle issues around numeracy in England are laudable. The PM’s assertions that higher attainment in mathematics will “help young people in their careers and grow the economy” are not wrong. It is an uncomfortable fact that England consistently scores poorly when compared to other OECD nations for adult numeracy.

Lower numeracy is associated with poorer financial wellbeing for individuals. At the population-level, low-levels of maths skills could be costing the economy billions.

It is also true that there is a much greater stigma attached to illiteracy than there is to innumeracy. You don’t hear people boasting of not being able to read in the same way that people will proudly assert how poor they are at mathematics.

In part, this is because it is much harder to function day-to-day with poor literacy than it is with poor numeracy. But poor numeracy can have hidden and wide-ranging impacts with, for example, one in four people surveyed recently suggesting they had been put off applying for a job because it involved numbers or data.

However, it is not clear that Sunak’s previously announced plan to enforce compulsory mathematics until the age of 18 will tackle these problems effectively. In reality we need a more holistic approach which tackles the stigmas surrounding the study of quantitative subjects throughout primary and secondary education.

By the age of 16, the battle for the prestige of mathematics has already been lost for many of our young people. It is possible that enforcing further mathematical study on these disaffected young adults will make the problem worse, not better.

The blanket policy of compulsory maths for everyone in education up to the age of 18 has the potential to backfire, putting pupils off post-16 education completely.

Instead, we need to work to change attitudes towards numeracy from the very earliest stages of our children’s mathematical education. Hands-on mathematics discovery centres, such as the recently launched MathsCity in Leeds, are one way in which we can hope to build a fun and engaging image of mathematics for our children from an early age.

Illustrating the importance and relevance of maths and the opportunities it can open up as part of the curriculum – something that is currently being attempted by the relatively new “core maths” qualification – might also help to improve attitudes towards mathematics.

Perhaps the biggest threat to the quality of maths education in England today is the long-term shortfall in the number of maths teachers in post. Despite significantly reducing their target for the recruitment of maths teachers, the government again failed to hit even this diminished objective in 2022.

Almost half of all secondary schools are already using non-specialist teachers for maths lessons.

How does the prime minister expect to expand our mathematics education opportunities when we can’t even fill the posts required for our current provision?

Given that the current industrial action being waged by teachers has been triggered by the erosion of teachers’ pay and conditions, and with no resolution to the dispute on the horizon, it is unclear how the government will be able to tackle even the current deficit in teacher numbers let alone recruit enough to deliver an expanded curriculum.

Whilst the idea of improved numeracy for all is an important one – and one which if achieved would significantly benefit both the people of the UK as individuals and the nation as a whole – it is not clear that there is a plan in place to deliver this effectively.

Presumably, Sunak’s expert-led review will be charged with advancing just such a plan. But without the teachers required to cope even with our current educational demands and no satisfactory resolution to strike action on the horizon, it remains to be seen how we will possibly implement any plan to improve numeracy that requires an expansion in our ability to deliver relevant, engaging and inspiring maths lessons.

How do we know health screening programmes work?

This post is adapted from my Conversation article of the same title originally published on 30/07/23

The UK is set to roll out a national lung cancer screening programme for people aged 55 to 74 with a history of smoking. The idea is to catch lung cancer at an early stage when it is more treatable.

Quoting NHS England data, the health secretary, Steve Barclay, said that if lung cancer is caught at an early stage, “patients are nearly 20 times more likely to get at least another five years to spend with their families”.

Five-year survival rates are often quoted as key measures of cancer treatment success. Barclay’s figure is no doubt correct, but is it the right statistic to use to justify the screening programme?

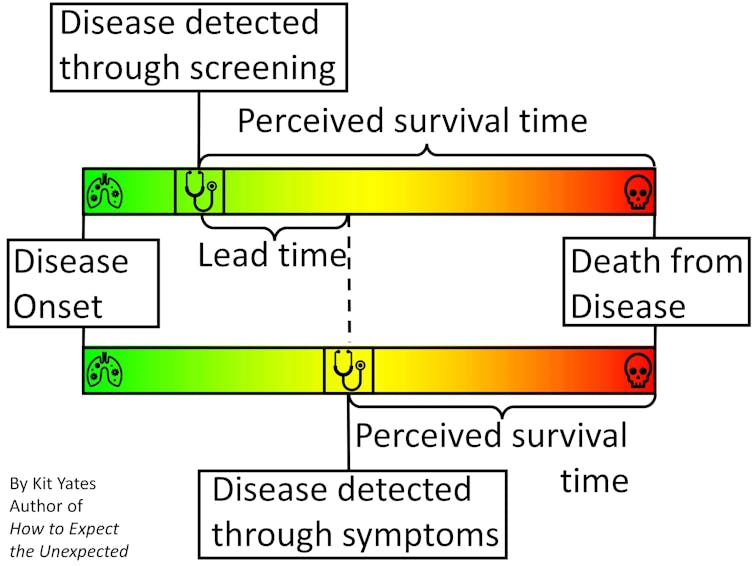
Time-limited survival rates (typically given as five-, ten- and 20-year) can improve because cancers caught earlier are easier to treat, but also because patients identified at an earlier stage of the disease would live longer, with or without treatment, than those identified later. The latter is known as “lead-time bias”, and can mean that statistics like five-year survival rates paint a misleading picture of how effective a screening programme really is.

A graphic to illustrate the impact of lead-time bias on the perceived survival length of a disease detected with screening v symptoms.
Lead-time bias can appear to make a treatment more effective than it actually is, if the perceived post-diagnosis survival time increases while the course of disease progression is unaffected. Kit Yates

My new book, How to Expect the Unexpected, tackles issues exactly like this one, in which subtleties of statistics can give a misleading impression, causing us to make incorrect inferences and hence bad decisions. We need to be aware of such nuance so we can identify it when it confronts us, and so we can begin to reason our way beyond it.

To illustrate the effect of lead-time bias more concretely, consider a scenario in which we are interested in “diagnosing” people with grey hair. Without a screening programme, greyness may not be spotted until enough grey hairs have sprouted to be visible without close inspection. With careful regular “screening”, greyness may be diagnosed within a few days of the first grey hairs appearing.

People who obsessively check for grey hairs (“screen” for them) will, on average, find them earlier in their life. This means, on average, they will live longer “post-diagnosis” than people who find their greyness later in life. They will also tend to have higher five-year survival rates.

But treatments for grey hair do nothing to extend life expectancy, so it clearly isn’t early treatment that is extending the post-diagnosis life of the screened patients. Rather, it’s simply the fact their condition was diagnosed earlier.

To give another, more serious example, Huntington’s disease is a genetic condition that doesn’t manifest itself symptomatically until around the age of 45. People with Huntington’s might go on to live until they are 65, giving them a post-diagnosis life expectancy of about 20 years.

However, Huntington’s is diagnosable through a simple genetic test. If everyone was screened for genetic diseases at the age of 20, say, then those with Huntington’s might expect to live another 45 years. Despite their post-diagnosis life expectancy being longer, the early diagnosis has done nothing to alter their life expectancy.

Overdiagnosis

Screening can also lead to the phenomenon of overdiagnosis.

Although more cancers are detected through screening, many of these cancers are so small or slow-growing that they would never be a threat to a patient’s health – causing no problems if left undetected. Still, the C-word induces such mortal fear in most people that many will, often on medical advice, undergo painful treatment or invasive surgery unnecessarily.

The detection of these non-threatening cancers also serves to improve post-diagnosis survival rates when, in fact, not finding them would have made no difference to the patients’ lives.

So, what statistics should we be using to measure the effectiveness of a screening programme? How can we demonstrate that screening programmes combined with treatment are genuinely effective at prolonging lives?

The answer is to look at mortality rates (the proportion of people who die from the disease) in a randomised controlled trial. For example, the National Lung Screening Trial (NLST) found that in heavy smokers, screening with low-dose CT scans (and subsequent treatment) reduced deaths from lung cancer by 15% to 20%, compared with those not screened.

So, while screening for some diseases is effective, the reductions in deaths are typically small because the chances of a person dying from any particular disease are small. Even the roughly 15% reduction in the relative risk of dying from lung cancer seen in the heavy smoking patients in the NLST trial only accounts for a 0.3 percentage point reduction in the absolute risk (1.8% in the screened group, down from 2.1% in the control group).

For non-smokers, who are at lower risk of getting lung cancer, the drop in absolute risk may be even smaller, representing fewer lives saved. This explains why the UK lung cancer screening programme is targeting older people with a history of smoking – people who are at the highest risk of the disease – in order to achieve the greatest overall benefits. So, if you are or have ever been a smoker and are aged 55 to 74, please take advantage of the new screening programme – it could save your life.

But while there do seem to be some real advantages to lung cancer screening, describing the impact of screening using five-year survival rates, as the health secretary and his ministers have done, tends to exaggerate the benefits.

If we really want to understand the truth about what the future will hold for screened patients, then we need to be aware of potential sources of bias and remove them where we can.

The hidden dangers of two-party politics

This post is adapted from my Indy Voices article of the same title originally published on 26/01/22

With local elections upon us, many voters feel like they are faced with the same old tired choice between the two major political parties – Labour and the Conservatives.

Despite the existence of third candidates, election leaflets come through the door telling us “Lib Dems can’t win here” – effectively arguing the case for a straight fight between the two major parties in British politics. But, as we look forwards to the general election next year, there are sound mathematical reasons why two parties battling it out – a duel so to speak – is not good for democracy.

In a two-horse race, declines in popularity for one candidate are equivalent to gains in popularity for the other. If it is harder to boost one’s own image than it is to denigrate the other party, then the incentive is for the parties to batter each other with negative advertising, leaving the electorate to choose between a rock and a hard place. The introduction of a genuinely electable third party can change the campaigning dynamics from a straight duel to a “truel” – a battle between three parties.

Truels are a popular trope in the cinema, having been used to resolve plot issues in at least three Quentin Tarantino movies alone. Probably the most well-known example, though, features in one of the most famous movie scenes of all time: towards the climax of The Good, the Bad and the Ugly, the three eponymous characters stand in a triangle on the perimeter of a circular plaza each with hands hovering around their waists ready to draw. I won’t spoil the ending.

As I explore in my new book, How to Expect the Unexpected, truels can have strange and unexpected outcomes if the players’ strengths differ markedly. The strongest candidates may tend to focus their efforts on each other as the greatest threat to one another, sometimes leaving the weaker candidate with the best chance of winning.

A favourable strategy for weaker participants in a multiplayer competitive game – namely staying in the background while the best fighters duel it out – has been arrived at naturally over and over again in the animal kingdom. While two of the most impressive specimens fight it out, killing or injuring each other, subordinate males can nip in and mate with the female.

So well established is this practice across the animal kingdom that it has its own name. Kleptogamy is derived from the Greek words klepto, meaning “to steal” and gamos, meaning “marriage” or more literally “fertilisation”. The evolutionary game theorist, John Maynard-Smith – who came up with the theoretical idea of kleptogamy – preferred to call it the “sneaky f***er” strategy.

Returning to politics, in the run-up to the June 2009 Virginia Democratic gubernatorial primaries in the US, state senator Creigh Deeds was floundering. In one January poll he registered just 11 per cent support.

Over the next four months he only polled higher than 22 per cent once, as the other two candidates, Terry McAuliffe and Brian Moran, swapped the polling lead between themselves. Deeds’ fundraising campaign was also stuttering. In the first quarter of 2009 – a crucial period ahead of the election, he had raised just $600,000 compared to Moran’s $800,000 and McAuliffe’s $4.2 million. But in mid-May the game suddenly changed.

The candidates began to plough much of their remaining resources into negative advertising. Moran went hard at his main rival McAuliffe, criticising his record as a businessman. McAuliffe responded to his biggest threat Moran with his own ad, defending his record and accusing Moran of “trying to divide Democrats”. Moran hit out again, criticising McAuliffe’s campaign against incumbent president, Barack Obama, in the Democratic primaries preceding the 2008 election. Moran hoped that this would diminish McAuliffe’s standing in the eyes of the state’s crucial African American voters.

All the while, as the top two candidates chipped away at each other’s reputations, unassuming underdog, Creigh Deeds, was planting seeds of positivity with his self-promoting advertising campaign. When the Washington Post came out and endorsed Deeds in late May, many undecided voters recognised him as a reasonable alternative to the two former frontrunners.

Deeds’ popularity in the polls shot up and by early June he was polling at over 40 per cent. Each of the formerly stronger rivals seemed to have managed to convince Virginian voters that the other was not electable. In elections on 8 June Deeds won just under 50 per cent of the vote to McAuliffe’s 26 per cent and Moran’s 24 per cent – a landslide for the weakest candidate.

The assumption of a two-party system does the electorate a disservice. Our democracy would be healthier if genuine multiparty politics were a reality, keeping all the parties honest and disincentivising negative advertising.

Different voting systems, such as the proportional representation or the alternative vote, favoured by other countries, might be a way to achieve this. They have the advantage that no vote is wasted – people feel free to vote for their preferred candidate rather than the candidate who is most likely to beat the only viable alternative.

Until the UK arrives at a system that incentivises genuinely multiparty politics, we will be stuck choosing between the red devil and the deep blue sea.

What your name really means and how it can affect your life

This post is adapted from my Indy Voices article of the same title originally published on 17/07/23

What do these three people have in common? Usain Bolt, the world’s fastest man, Margaret Court, the former world-number-one tennis player, and Thomas Crapper, the plumber and toilet designer who, contrary to popular belief, did not actually give an abbreviated form of his name to a slang word for defecation.

You can probably guess it straight away. Their names are all aptronyms – names which are particularly suited to their owners.

Possibly less well-known examples, but arguably even better fitting are the Jamaican cocaine trafficker Christopher Coke, the British judge Igor Judge, and the American columnist Marilyn vos Savant (who between 1985 and 1989 was listed in the Guinness Book of Records as having the world’s highest IQ).

Sara Blizzard, Dallas Raines and Amy Freeze are all television weather presenters, Russell Brain is a British neurologist and Michael Ball is a former professional footballer. I could go on. Some of these examples seem almost too apposite to have happened by chance.

Some scientists suggest that the reason these people ended up being renowned for their particular speciality is a result of the influence, from an early age, of the name they bore. The hypothesis that such causative links exists is known as nominative determinism – a self-fulfilling prophecy I investigate in more detail in my new book, How to Expect the Unexpected.

One proposed explanation for why people might be drawn to professions which fit their name is a psychological phenomenon known as implicit egotism – the conjecture that people exhibit an often unconscious preference for things associated with themselves. That might be marrying someone with the same birthday, donating to good causes with a name that begins with their initial, or gravitating toward a job which relates to their name.

In support of this idea, James Counsell mused on his eventual career path as a barrister: “How much is down to the subconscious is difficult to say, but the fact that your name is similar may be a reason for showing more interest in a profession than you might otherwise.”

There are a limited number of studies which purport to provide evidence that nominative determinism is a real phenomenon. Perhaps the most amusing of these studies was conducted in 2015 by a family of doctors and soon-to-be doctors: Christopher, Richard, Catherine and David Limb. Together the four Limbs clearly had a vested interest in understanding whether their appendage-related name had drawn them towards their anatomically focussed professions. Indeed, given the vocation of David Limb as an orthopaedic surgeon (specialising in shoulder and elbow surgery), the Limbs decided to ask a more in-depth question – whether a doctor’s name could influence their medical specialisation.

By analysing the general medical council’s register, they found that the frequency of names relevant to medicine and its specialities was far greater than would be expected by chance alone. One in every 21 neurologists had a name directly relevant to medicine, like Ward or Kurer, although far fewer had names relevant to that particular speciality – no Brains or Parkinsons, for example.

The specialities next most likely to have medically relevant names were genitourinary medicine and urology. The doctors in these subfields also had the highest proportion of names directly relevant to their speciality, including Ball, Koch, Dick, Cox, a single Balluch, and even a Waterfall. As the Limbs pointed out in their paper, this may have had something to do with the wide array of terms that exists for the parts of the anatomy relevant to these subfields.

Ironically, despite the purported evidence for the phenomenon, the fact that the two younger Limbs followed their parents into their profession hints at a strong role for familial influence in determining careers (in medicine, at least).

Before we decide whether we believe that our names can influence our future trajectories though, it’s important we remember that for every aptronym we hear about, there are plenty of Archers, Taylors, Bishops and Smiths, for example, whose names do not have a clear correlation with corresponding employment. It is also important to remember that correlation does not imply causation. Not every aptronym is an example of nominative determinism.

Whether or not nominative determinism is a self-fulfilling prophecy, or just a fancy name given to a series of amusing coincidences, finding examples of aptronyms like the lawyer Sue You, the Washington news bureau chief William Headline, the pro-tennis player Tennys Sandgren, or the novelist Francine Prose will always make me smile.

How coin tosses can lead to better decisions

This post is adapted from my BBC Futures Article of the same title originally published on 19/08/23

If you’re anything like me then you might experience mild analysis paralysis when choosing what to order from an extensive menu. I am so indecisive that the waiter often has to come back a few minutes after taking everyone else’s order to finally hear mine. Many of the choices seem good, but by trying to ensure I select the absolute best, I run the risk of missing out altogether.

Even before the internet brought unprecedented consumer options directly into our homes and the phones in the palms of our hands, choice had long been seen as the driving force of capitalism. The ability of consumers to choose between competing providers of products and services dictates which businesses thrive and which bite the dust – or so goes the long-held belief. The competitive environment engendered by consumers’ free choice supposedly drives innovation and efficiency, delivering a better overall consumer experience.

However, more recent theorists have suggested that increased choice can induce a range of anxieties in consumers – from the fear of missing out (Fomo) on a better opportunity, to loss of presence in a chosen activity (thinking “why am I doing this when I could have been doing something else?”) and regret from choosing poorly. The raised expectations presented by a broad range of choices can lead some consumers to feel that no experience is truly satisfactory and others to experience analysis paralysis. That more options provide an inferior consumer experience and make potential customers less likely to complete a purchase is a hypothesis known as the “paradox of choice“. Indeed, experiments on consumer behaviour have suggested that excessive choice can leave consumers feeling ill-informed and indecisive when making a purchasing decision.

The best is the enemy of the good

The idea, particularly in subjective matters, that there is a perfect solution to a problem is known as the “Nirvana fallacy”. In reality, there may be no solution that lives up to our idealised preconceptions. When we step back a little from the decision we are trying to make, it usually becomes clear that, although there may be one best option, there will also be several good options with which we would be satisfied. Choosing an alternative that may not be the very best, but is at least good enough, has been christened “satisficing” – a portmanteau of “satisfying” and “suffice”. As the Italian proverb that the French writer and philosopher Voltaire recorded in his Dictionnaire philosophique goes: “Il meglio è l’inimico del bene” – “the best is the enemy of the good.”

Fortunately, as I detail in my new book – How to Expect the Unexpected – randomness offers us a simple way to overcome choice-induced analysis paralysis. When faced with a multitude of choices, many of which you would be happy to accept, flipping a coin or letting a dice decide for you may be the better option. Sometimes making a quick good choice is better than making a slow perfect one, or indeed being paralysed into complete indecision.

When struggling to choose between multiple options, having a decision seemingly made for you by an external randomising agent can help you to focus in on your true preference. This “randomised” strategy can help us to envisage the consequences of what was, up until that point, an apparently abstract decision. Recent experiments by a team of researchers at the University of Basel, Switzerland, have demonstrated that a randomly dictated decision prompt can help us to deal with the information overload that often precipitates analysis paralysis.

After reading some basic background information, three groups of participants were asked to make a preliminary decision about whether to fire or re-hire a hypothetical store manager. After forming an initial opinion, two of the three groups were told that, because these decisions can be hard to make, they would be assisted by a single computer-generated coin flip. The side the coin came down on would suggest whether to stick with their original decision (group 1) or to renege (group 2). Participants were told that they could ignore the coin flip outcome if they wanted to. All three groups were then asked if they would like more information (an indicator of analysis paralysis) or whether they were happy to make their decision based on what they already knew. Once those who asked for more information had received it, all participants were asked for their final decision.

The participants who were subjected to a coin flip were three times more likely to be satisfied with their original decision – not asking for more information – than those who had not been exposed to the randomised suggestion. The random influence of the coin had helped them to make up their minds without the need for more time-consuming research.

Interestingly, requests for further information were lower when the coin suggested the opposite of the participant’s original decision than when it confirmed the participant’s first thoughts. Being forced to contemplate the opposite standpoint made participants more certain of their original choice than when the coin flip simply reinforced their first decision.

While many of us would feel uncomfortable allowing a coin to dictate the direction of someone else’s career, it’s important to remember that you are not required to follow the decision of the randomiser blindly. The externally suggested choice is designed to put you in the position of having to seriously contemplate accepting the specified option, but doesn’t force your hand one way or the other.  

For those of us who struggle to make decisions, however, it’s comforting to know that when grappling with a selection, we can get out a coin and allow it to help. Even if we resolve to reject the coin’s prescription, being forced to see both sides of the argument can often kickstart or accelerate our decision-making process.

Here’s why the new ‘girl math’ trend just doesn’t add up

This post is adapted from my Indy Voices article of the same title originally published on 24/08/23

The new splurge now, justify the cost later craze has taken social media by storm. Good, harmless fun? Not by my calculations, says mathematician Kit Yates

f you want to get a lifestyle craze trending on social media, then you could do worse than stick the word “girl” in its name.

That’s how we got “hot girl walk” – a trend promoting both the mental and physical health benefits of walking – and “lazy girl job” – a phenomenon extolling the virtues of improving your work life balance. There’s also “girl dinner”, which sent the internet into a frenzy over its simple prescription of low-effort snack-based dining, and now the newest addition to the crowd: “girl math”.

Many of the “girl” trends have had their share of criticism, from accusations that lazy girl job promotes low career aspirations to suggestions that girl dinner might encourage unhealthy dietary choices.

But, to me, “girl math” feels a bit more troubling than the previous trends. It originates from a New Zealand radio show in which women ring in to describe and justify expensive purchases they’ve made. The hosts then use some basic maths to help the caller feel better about the money they’ve blown. For example, to justify buying a $1,000 designer bag, “girl mathematicians” might give it a five-year lifetime and calculate its cost per day of just 55 cents. Add in multiple uses for the bag (eg handbag, cabin bag, shopping bag, festival bag) and you might find it’s actually saving you from having to spend more money on other items.

It’s a funny trope, which is why “girl math” videos are getting millions of views on social media – particularly on TikTok. It’s also getting people to do a little bit of real-world maths which (although not super high-level) from my viewpoint as a professional mathematician is always welcome.

Indeed, calculating the daily cost of a purchase over its lifetime is not a terrible suggestion when it comes to budgeting, although it’s a calculation you should really do before making the big-ticket purchase rather than to justify it afterwards.

I have a couple of gripes with the trend, however. My first issue is with the name itself. Mathematicians have fought and indeed continue to fight a battle for representation in our traditionally male-dominated subject. We constantly struggle against tropes that suggest maths isn’t for girls or that “girls don’t like hard maths” – a theory advanced by the government’s former social mobility tsar Katharine Birbalsingh.

So I find the idea that there is maths for girls (the “girl math” trope typically employing fairly straightforward calculations) and by implication maths for boys, hard to stomach. As I have argued previously, it’s important that we continue to reinforce the idea that all of maths is for everyone.

Sometimes the logic underlying girl math TikToKs can leave a little to be desired. For example, under the unwritten rules of “girl math”, returning an item of clothing that costs $50 and then buying another item with a price tag of $100 means that that second item, in fact, only cost $50. Again, I know it’s a joke, but the justification of clearly flawed reasoning by its association with girls, as if this is a trait specific to women, doesn’t do anything to dispel long-held and damaging stereotypes.

Similar to the “women are bad drivers” trope (which is a pernicious myth), this sort of stereotype can seep into the view that the caricatured group hold of themselves. “Dubious math” would be a far more accurate name for the trope, as well as removing its stigmatising impact, but of course, it wouldn’t capitalise on the “girl” trend and perhaps would never have gone viral in the first place.

My other issue with the trend is that, for some people, “girl math” may become more than just a joke.  Some of the more worrying tropes that “girl math” relies on are that “cash isn’t real money” or that purchases under $5 are “pretty much free”.

Indeed, in line with the “cash isn’t real money” trope, there is evidence to suggest that people pay in cash for purchases they find harder to justify to themselves so that there is no electronic paper trail. This makes it easier for the guilt associated with the offending purchase to be forgotten and similar purchases repeated in the future. Reversing a seductive “girl math” calculation for the $5 trope, it’s also worth working out that a $5 purchase every day of the year adds up to $1,825 over the course of a year – a significant portion of most people’s annual budget.

I’m all in favour of spending our hard-earned salaries on the things we enjoy and which make our lives better – we need these perks to lighten our moods in these difficult economic times – but it’s important to remember there is a literal price tag attached to those purchases.

I am advocating for spending our money with agency and intention – budgeting and planning in order to make the treats we buy ourselves viable in the long term, avoiding the post hoc “girl math” justifications that could lead to unsustainable spending habits.

Why mathematicians sometimes get Covid projections wrong

This post is adapted from my Guardian Article of the same title originally published on 26/01/22

Modelling may not be a crystal ball, but it remains the best tool we have to predict the future

Official modelling efforts have been subjected to barrages of criticism throughout the pandemic, from across the political spectrum. No doubt some of that criticism has appeared justified – the result of highly publicised projections that never came to pass. In July 2021, for instance, the newly installed health secretary, Sajid Javid, warned that cases could soon rise above 100,000 a day. His figure was based on modelling from the Scientific Pandemic Influenza Group on Modelling, known as SPI-M.

One influential SPI-M member, Prof Neil Ferguson, went further and suggested that, following the “freedom day” relaxation of restrictions on 19 July, the 100,000 figure was “almost inevitable” and that 200,000 cases a day was possible. Cases topped out at an average of about 50,000 a day just before “freedom day”, before falling and plateauing between 25,000 and 45,000 for the next four months.

It is incredibly easy to criticise a projection that didn’t come true. It’s harder, however, to find out which were the assumptions that made the projection wrong. And, of course, it’s harder still to do that before the projection has been shown to be incorrect. But that is what we ask our modellers to do, and we are quick to complain when their projections do not match reality. Much of the criticism they have received, however, has been misplaced, born out of fundamental misunderstandings of the purpose of mathematical modelling, what it is capable of – and how its results should be interpreted.

Mathematical models are predicated on assumptions – how effective the vaccine is, how severe a variant is, what the impact of imposing or lifting whole rafts of mitigations will be. In trying to put a number on even these few unknowns, let alone the tens or even hundreds of others needed to represent reality, modellers are often searching in the dark with weak torches. That is why broad ranges of scenarios are modelled, and why strict caveats about the uncertainty in the potential outcomes typically accompany modelling reports.

Mathematicians will be the first to tell you that the output of their models are “projections” predicated on their assumptions, not “predictions” to be viewed with certainty. To be fair to him, when Ferguson suggested the figure of 200,000 cases a day, he placed it in the context of the substantial uncertainty surrounding the projection. “And that’s where the crystal ball starts to fail,” he said, “… it’s much less certain.”

Unfortunately, such caveats often get lost when modelling is simplified and turned into attention-grabbing headlines. One accusation levelled at UK modelling is that projections are often presented in the media with insufficient accompanying context. While it isn’t always possible to expect modellers who are working flat-out to find time to do media rounds, the resulting communication vacuum can leave results open to misinterpretation or exploitation by bad-faith actors.

Critics of modelling also fail to acknowledge that highly publicised projections can become self-defeating prophecies.Top of the list of the Spectator’s “The ten worst Covid data failures” in the autumn of 2020 was “Overstating of the number of people who are going to die”. The article referred to the fact that Imperial College modellers’ infamous projection – that the UK would see 250,000 deaths in the absence of tighter measures – never came to pass. The Imperial model is widely credited with causing people to change their behaviour and with eventually ushering in the first UK lockdown a week later, thus averting its own alarming projections. Given that the UK has already passed 175,000 Covid deaths, it isn’t hard to imagine that upwards of 250,000 could have died as the result of an unmitigated epidemic wave.

There have been scenarios in which modellers have taken missteps. Modellers often attempt to answer questions about subjects on which they are not experts. They need to collaborate closely with individuals and organisations who have relevant expertise. When considering care homes in the first wave of the pandemic, for instance, a number of salient risk factors – including the role of agency staff covering multiple care homes – were known to industry practitioners but were not anticipated by the mathematicians. These considerations meant that recommendations based on the modelling may have been unsound. There were more than 27,000 excess deaths in care homes during the first wave of the pandemic in England and Wales.

Data sharing between modelling groups has also been identified as an area that needs improvement. Early on in the pandemic, unequal access to data and poor communication were implicated in modelling results that suggested the UK’s epidemic trajectory was further behind Italy than it was, possibly contributing to a delay in our first lockdown. In these respects the pandemic has been a very public learning process for mathematicians.

Every time someone interprets data – from professional mathematicians and politicians to the general public – they are using a model, whether they acknowledge it or not. The difference is that good modellers are upfront about the assumptions that influence their outcomes. If you don’t agree with the underlying assumptions then you should feel free to take issue with the projections – but dismissing conclusions because they don’t fit a worldview is naive, at best.

Despite these reservations, modelling remains the best tool we have to predict the future. It provides a framework to formalise our assumptions about the scenarios we are trying to represent and to suggest what might happen under different policy options. It is always a better option than relying on the gut feelings, “common sense” or plain old wishful thinking that would replace it.